![OSI SOLUTIONS FINAL JPEG-01[3].jpg](https://static.wixstatic.com/media/93bf49_ff276ec9c565489187349dc0b3af8ef9~mv2.jpg/v1/fill/w_150,h_182,al_c,q_80,usm_0.66_1.00_0.01,enc_avif,quality_auto/OSI%20SOLUTIONS%20FINAL%20JPEG-01%5B3%5D.jpg)


Simple Guide Windows Server 2012 R2 Centralize Monitoring
- Hamizi Jamaluddin
- Aug 1, 2019
- 3 min read

Hi all, Yesterday I posted a Step by Step on how Server Admin can configure Windows Server 2012 R2 Core in Domain environment.
Today I going to show you all a very simple step on how to Centralized Monitor member server in your Domain Infrastructure using Performance Monitor that available in Windows Server 2012 R2.
For those who'r not sure what is Performance Monitor all about, Windows Performance Monitor is a Microsoft Management Console (MMC) snap-in that provides tools for analysing system performance. From a single console, you can monitor application and hardware performance in real time, customize what data you want to collect in logs, define thresholds for alerts and automatic actions, generate reports, and view past performance data in a variety of ways.
Please refer here for more info : http://technet.microsoft.com/en-us/library/cc749249.aspx
For this Demo, I'm using my ComSys.local domain consist of 4 Servers which is 3 Servers running GUI and 1 Server core, all 4 Servers running on Windows Server 2012 R2. But for this Monitoring purposes, I will use ComSys SVR01 Server..
So.. lets get started...
1 - On the domain Server, in my case ComSys DC01 Server, open Server Manager and then Right Click All Servers and choose Add Servers..
** I wanted to make sure all my Server in my domain is on-line and to make sure the performance counter is started.


2 - On the Add Server box, Click Find Now button to detect all on-line server available... then Choose all the server you want to start the performance counter and click the Arrow button next to Operating System to add the Server..


3 - Verify the Server in the Selected box and click OK...


4 - Verify again that all the Server in your Infra is in the on-line Status..


5 - Next, Log in to your Server that you want to perform the monitoring, in my case I will use ComSys SVR01... On the Server Manager, Click Tools and then click Performance Monitor..


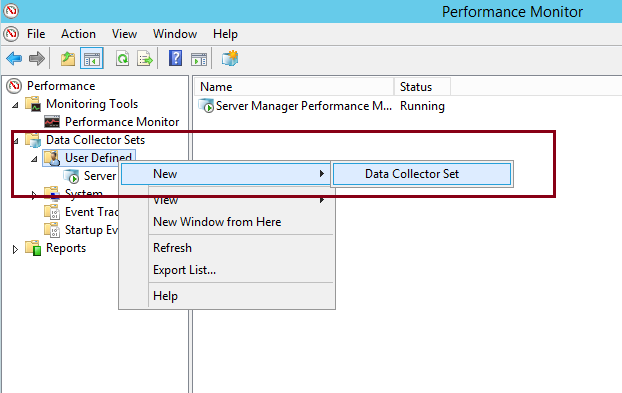
6 - On the Performance Monitor MMC, open Data Collector Sets, and then click User Defined... right click User Defined, click New, and then click Data Collector Set...

7 - Next, on the Create new Data Collector Set box, enter name that you prefer, for this demo I use ComSys SVR01 Server Monitoring and select Create manually (Advanced)... then click Next to proceed...


8 - Next, on the What type of data do you want to include? box, click Create data logs and then select the Performance Counter then click Finish...


9 - Next again, click Data Collector Sets, double click User Defined, right click ComSys SVR01 Server Monitoring and then click New and choose Data Collector...


10 - On the Create New Data Collector box... in the Name box, type Base ComSys Server01 Monitoring and select Performance counter data collector, then click next....


11 - On the Create New Data Collector box, click Add button...


12 - Next, In the Available counters object list, you can choose any counter that you prefer to monitor your Server, for this Demo I select Available Mbyes, Current Bandwidth and %Processor Time... then click OK...


13 - Next on the Create New Data Collector box, verify your selected Performance counter and click Finish.. You also can modify the Interval for Performance Counters (for this demo I remain the default 15 second)


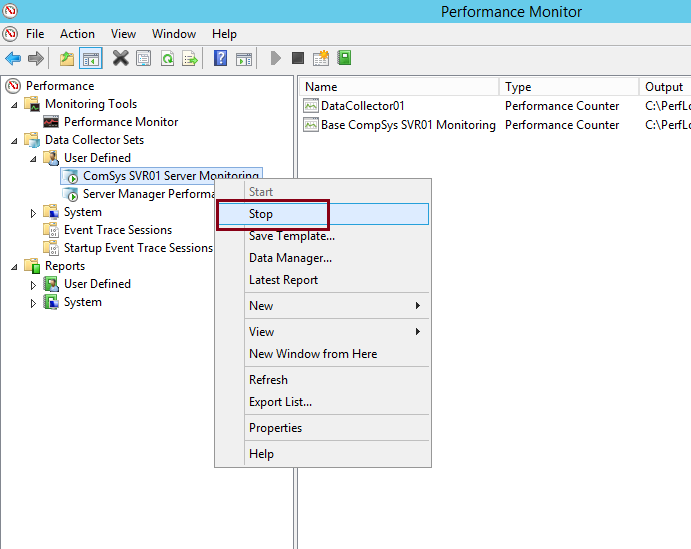
14 - Now lets start the monitoring.. Right click ComSys SVR01 Server Monitoring and choose Start....


15 - Now you just wait for few minutes to let any activity running in your Server... then you can stop the monitoring...

16 - Lastly, double click Reports, expand the User Defined, then expand ComSys SVR01 Server Monitoring and click SVR01_ date to review your Monitoring Result/Report...


Comments